Algorithm benchmarking
[2]:
from pydistsim.logging import enable_logger
from pydistsim.benchmark import AlgorithmBenchmark
from pydistsim.demo_algorithms.broadcast import Flood
from pydistsim.network.behavior import NetworkBehaviorModel
[3]:
enable_logger()
Set-up the benchmark
Pass algorithm, network sizes to test and the network behavior.
Then run the benchmark.
[4]:
benchmark = AlgorithmBenchmark(
    ((Flood, {"initial_information": "Hello Wold!"}),),
    network_sizes=range(1, 20),  # equivalent to [1, 2, 3, ..., 19]
    network_behavior=NetworkBehaviorModel.UnorderedRandomDelayCommunication,  # You can define their own network behavior, check behavior vizualization notebook
)

benchmark.run()
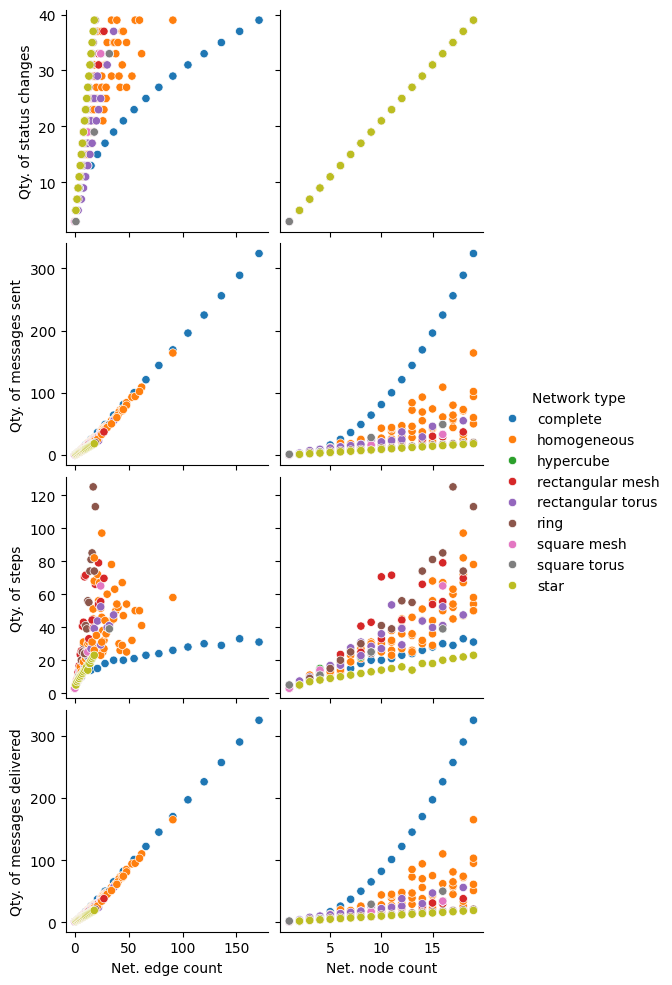
Automatically generated plots with the results
[5]:
benchmark.plot_analysis() # Create a plot
[5]:
<seaborn.axisgrid.PairGrid at 0x7fe2df155bd0>
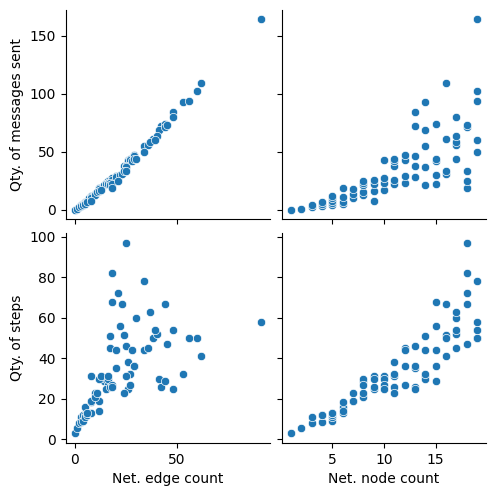
Filter the results by network type and only show specific graphs:
[6]:
benchmark.plot_analysis(
    y_vars=["Qty. of messages sent", "Qty. of steps"],
    result_filter=lambda result: result["Network type"] == "homogeneous",
)
[6]:
<seaborn.axisgrid.PairGrid at 0x7fe2df0b13d0>
Get the data as a pandas DataFrame for in-depth analysis
[7]:
df = benchmark.get_results_dataframe()  # Get the results as a pandas DataFrame

df  # This will display the results as a table
[7]:
| Net. node count | Net. edge count | Network type | Qty. of messages sent | Qty. of messages delivered | Qty. of status changes | Qty. of steps | |
|---|---|---|---|---|---|---|---|
| 0 | 1 | 0 | complete | 0 | 1 | 3 | 3 |
| 1 | 1 | 0 | hypercube | 0 | 1 | 3 | 3 |
| 2 | 1 | 0 | ring | 0 | 1 | 3 | 3 |
| 3 | 1 | 0 | square mesh | 0 | 1 | 3 | 3 |
| 4 | 1 | 1 | square torus | 1 | 2 | 3 | 5 |
| ... | ... | ... | ... | ... | ... | ... | ... |
| 349 | 16 | 24 | rectangular mesh | 33 | 34 | 33 | 63 |
| 350 | 18 | 36 | rectangular torus | 55 | 56 | 37 | 44 |
| 351 | 19 | 56 | homogeneous | 94 | 95 | 39 | 50 |
| 352 | 18 | 27 | rectangular mesh | 37 | 38 | 37 | 74 |
| 353 | 15 | 30 | rectangular torus | 46 | 47 | 31 | 39 |
354 rows × 7 columns